
The short answer
Open Activity Monitor, sort the CPU tab by % CPU and the Memory tab by Memory, and look at the Memory Pressure graph. One app near the top for minutes at a time is usually the cause; quit it or restart it. Names like mds_stores (Spotlight), photoanalysisd (Photos) or bird (iCloud Drive) are macOS catching up and settle on their own; kernel_task high means the Mac is hot. If the slowdown is gone before you look, use a monitor that keeps history, such as Almanac (free), to see which app was busy at that moment.
The beach ball spins. The fans come on while you are only reading email. Typing lags a beat behind your fingers. It is tempting to conclude the Mac is getting old, but a Mac that was fine last week rarely slows down from age. Almost always, one specific thing is using more than its share, and it can be found.
We make Almanac, a free Mac activity monitor, and we will get to it. But the first tool is already on your Mac.
Start with Activity Monitor
- Press ⌘ Space, type Activity Monitor and press Return.
- On the CPU tab, click the % CPU column so the busiest process is at the top.
- Watch for twenty or thirty seconds. Something that flickers to the top and drops away is normal. Something that sits there is your suspect.
- Do the same on the Memory tab, sorted by Memory, and glance at the Memory Pressure graph at the bottom.
Reading the four numbers that matter
- % CPU. 100 percent means one full core. An app at 100 to 200 percent for minutes on end, when you are not exporting video or compiling, is stuck or doing something heavy in the background.
- Memory Pressure. More useful than the “memory used” total, which is always high because macOS uses spare memory for caching. Green is fine. Yellow means the Mac is compressing and shuffling to make room. Red means it needs more than it has, and everything slows.
- Energy Impact. On the Energy tab. On a laptop, this is the number to check when the battery drains fast or the bottom gets warm.
- Disk. An app writing gigabytes, on the Disk tab, can slow everything down even when the CPU looks calm.
What the strange process names mean
Half of what you see in Activity Monitor is macOS itself, under names that were never meant for people. These are the ones that most often show up near the top.
| Process | What it is | What to do |
|---|---|---|
kernel_task | The core of macOS. It shows high CPU when the Mac is hot, holding time back so the chip can cool. | Find the real heat source: another busy app, a warm room, a laptop on a duvet. |
WindowServer | Draws everything on your screens. | Climbs with many windows, external displays and animation. Close what you are not using. |
mds, mds_stores, mdworker | Spotlight indexing your files. | Busy after a macOS update or a big copy. Leave it; it settles. |
photoanalysisd | Photos analysing your library for people, places and memories. | Busy after importing many photos. It works mostly while the Mac is idle. |
bird, cloudd | iCloud Drive and other iCloud sync. | Busy while a lot of files upload or download. Check iCloud in Finder’s sidebar. |
backupd | Time Machine making a backup. | Normal for a while after you plug in the backup disk. |
None of these should be force quit. If one stays busy for hours rather than minutes, a restart usually settles it.
When the slowdown is gone by the time you look
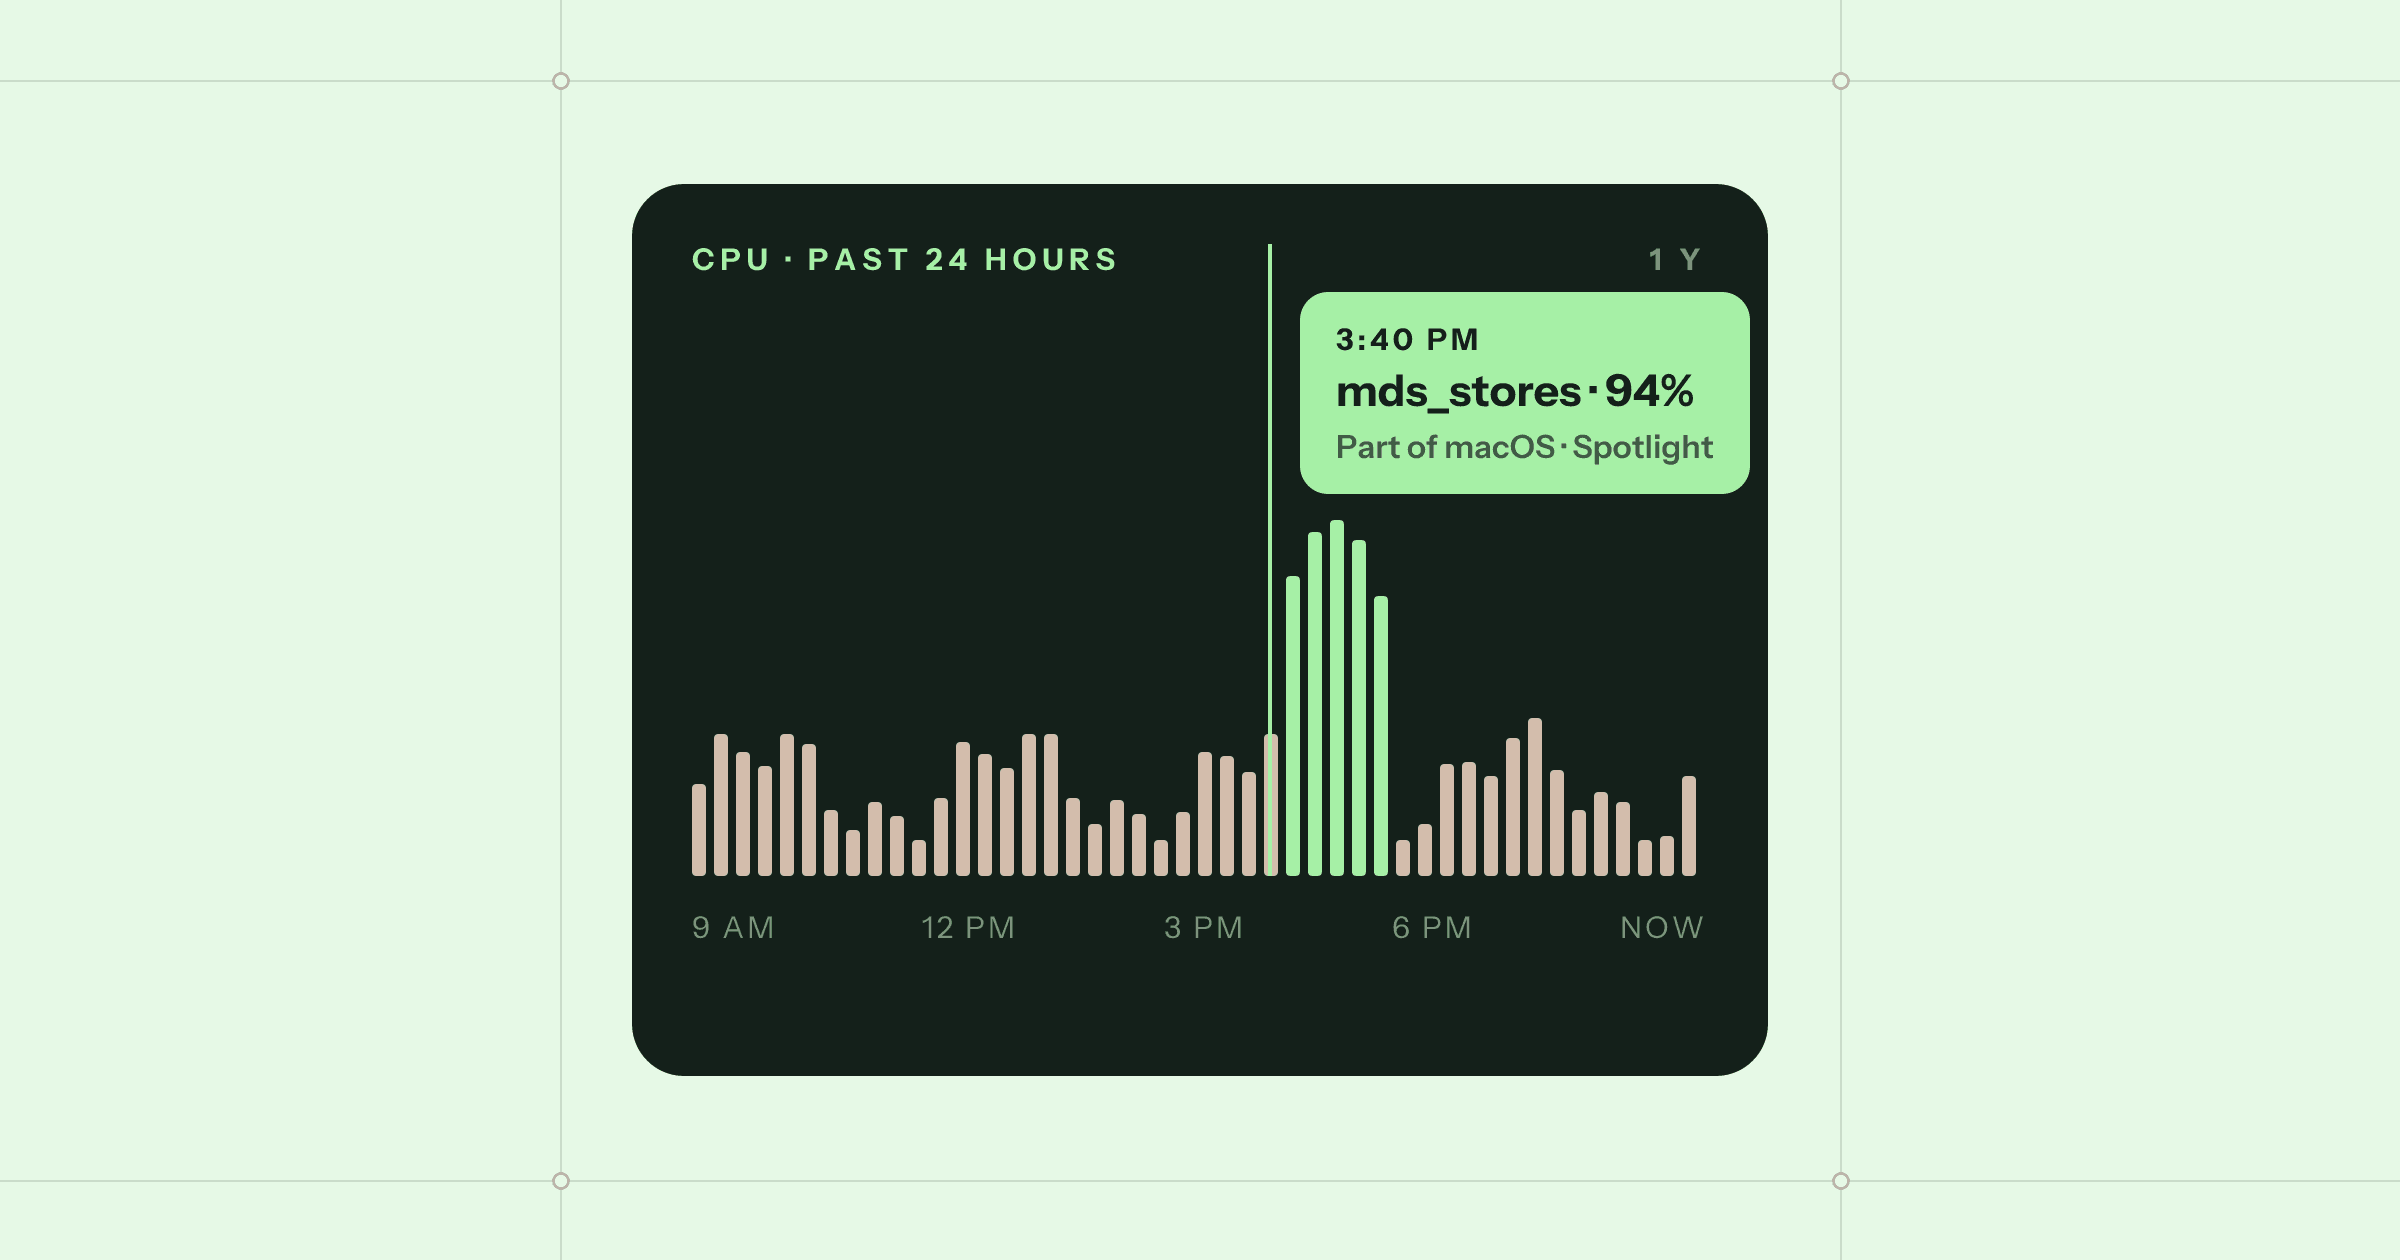
This is the frustrating case. The Mac crawled during the video call at 3:40, and by the time the call ended and you opened Activity Monitor, everything was calm. Activity Monitor shows the present. It has no memory of what happened twenty minutes ago.
That gap is the reason we built Almanac. It records every metric and the busiest apps once a minute for the last week and hourly beyond that, for up to a year. Open CPU, Memory, Disk or Network, pick 24 h or 7 d, and hover the chart at 3:40 to see which apps were busiest at that moment.
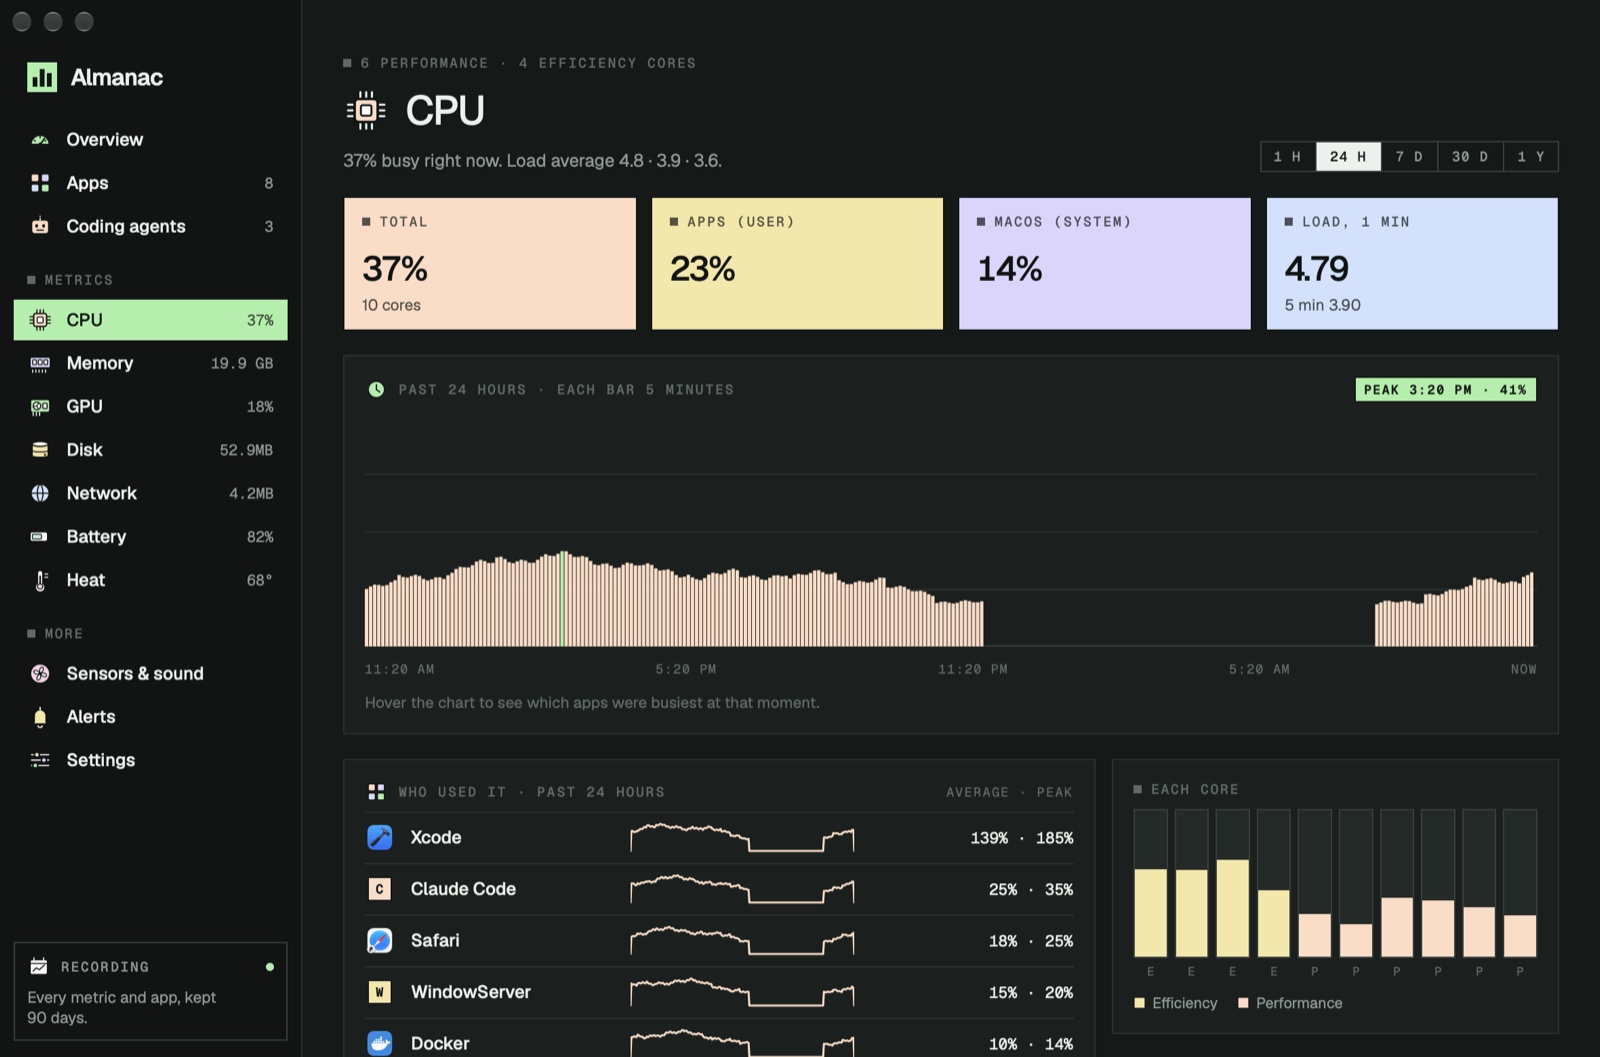
Two other things make Almanac quicker to read than a list of processes. Each app’s helpers are counted under the app, so every browser tab adds up to the browser and every compiler to Xcode, and the app costing your Mac the most is simply at the top. Parts of macOS are shown by name in grey and marked as such, so you know not to quit them. It can also tell you when something misbehaves: an app that keeps a core busy for five minutes, memory that keeps growing for an hour, or an app writing more than 5 GB in a day.
Fixes that actually help
- Quit the one app, not everything. Once you know which app it is, quitting and reopening it fixes most runaway processes.
- Restart once in a while. Macs can go weeks without one, and some background services slowly misbehave over that time.
- Keep 10 to 15 percent of the disk free. macOS needs room to swap memory and install updates; a nearly full disk slows everything.
- Look at login items. System Settings › General › Login Items lists what starts with your Mac. Remove what you do not use every day.
- Mind the heat. A hard surface under a laptop matters more than most settings.
Almanac is free, needs macOS 15 or later, runs on Apple silicon and Intel, and keeps everything on the Mac. If you use Claude Code or Codex, it also shows each live session and how much of your plan’s limits are used. The help pages explain every chart.
Questions
Why is kernel_task using so much CPU?
macOS uses kernel_task to keep the processor cool: when the Mac is hot, it holds CPU time so other apps cannot use it. The real cause is heat, often from another busy app, a warm room or blocked vents.
Is it safe to quit WindowServer or mds_stores?
No. They are part of macOS. WindowServer draws everything on screen and mds_stores is Spotlight's index. If one stays busy for a very long time, restarting the Mac usually settles it.
How much memory pressure is too much?
Look at the Memory Pressure graph in Activity Monitor rather than the used total. Green is fine even when memory looks full; yellow means the Mac is working to make room; red means it needs more memory than it has, and things will feel slow.
Can I see what my Mac was doing yesterday afternoon?
Not in Activity Monitor, which only shows the present. Almanac keeps a record once a minute for a week, then hourly, for up to a year, with the busiest apps at each moment.
Is Almanac free?
Yes. Almanac is free, with no account and no subscription. It needs macOS 15 or later and runs on Apple silicon and Intel.

 Whittle
 PennyBook
 Porter